More-than-human psychogeography
on “bat-like” places and imaginary geographie
Jin-Kyu Jung & Ted Hiebert
The Project: What is it like?
What is it like? is an experiment in psychogeography[i], taking literally the idea that thoughts and ideas might be seen as places we can go to and attempting to start discussions about what this reconceptualization of the mind might mean. The project is also an engagement with what we call imaginary data—by which we mean a form of data that refers not to empirical phenomena but to the processes of imagination themselves. In this sense, imaginary data operates on several levels: metaphorically (as a figure for subjective, affective experience), critically (as a challenge to the empiricist expectation that data must be objectively verifiable), and methodologically (as a participatory way of scaffolding and visualizing the act of imagining itself). We are not so much trying to map the imagination as to structure and support imaginative engagement—treating imagination as a space one can enter, explore, and perhaps even measure, without reducing its qualitative complexity. It is less a survey of the mind and more of an attempt at providing direction or possibilities. It is like a guided meditation but with a twist—not designed as a self-help tool but rather as a conversation about what happens when we treat seriously the places that our minds are able to take us—mapping the mind’s spatiality.
The project is also a response to—and in some ways a critique of—a 1974 essay in the field of consciousness studies by a researcher named Thomas Nagel[ii]. The essay was called “What is it like to be a bat?” and, in it, Nagel argued that there is nothing that it is like to be a bat. It was a comment about the subjective nature of consciousness and the problem of subjectivity. He called it “nothing” because what it’s like to be a bat is as incommensurable as the question of what it’s like to be you or me—perhaps even more so as we consider the more-than-human dimensions of such questions. He said that there is “something it is like” to be a conscious being, but that this “something” cannot really be understood scientifically. He went further to suggest that "we are completely unequipped to think about the subjective character of experience without relying on the imagination," something that—for Nagel—was a problem. In contrast, our project centers the unique capacity of the imagination to provide encounters with that which cannot be known directly, as an embodied critique of Nagel's assertions.
The structure of the project is rather simple. Participants are invited to think and talk about bats, aided when possible by presentations from experts in the field. For our project, Dr. Sharlene Santana[iii]—a bat researcher from the University of Washington—gave a lecture and answered questions on her research about bats. Participants were then invited to spend a short period of time imagining what it is like to be a bat. We recorded their brainwaves using a commercial-grade electroencephalography (EEG) sensor, which also provided a visualization of the participant’s brainwaves. This data was mapped later and cross-referenced with standard brainwave bandwidths (alpha, beta, delta, and theta) which allowed us some insight into the various states of cognition and immersion experienced by each participant. After their visualization sessions, participants answered a short questionnaire designed to give us some anchor points for their particular experience of the experiment.
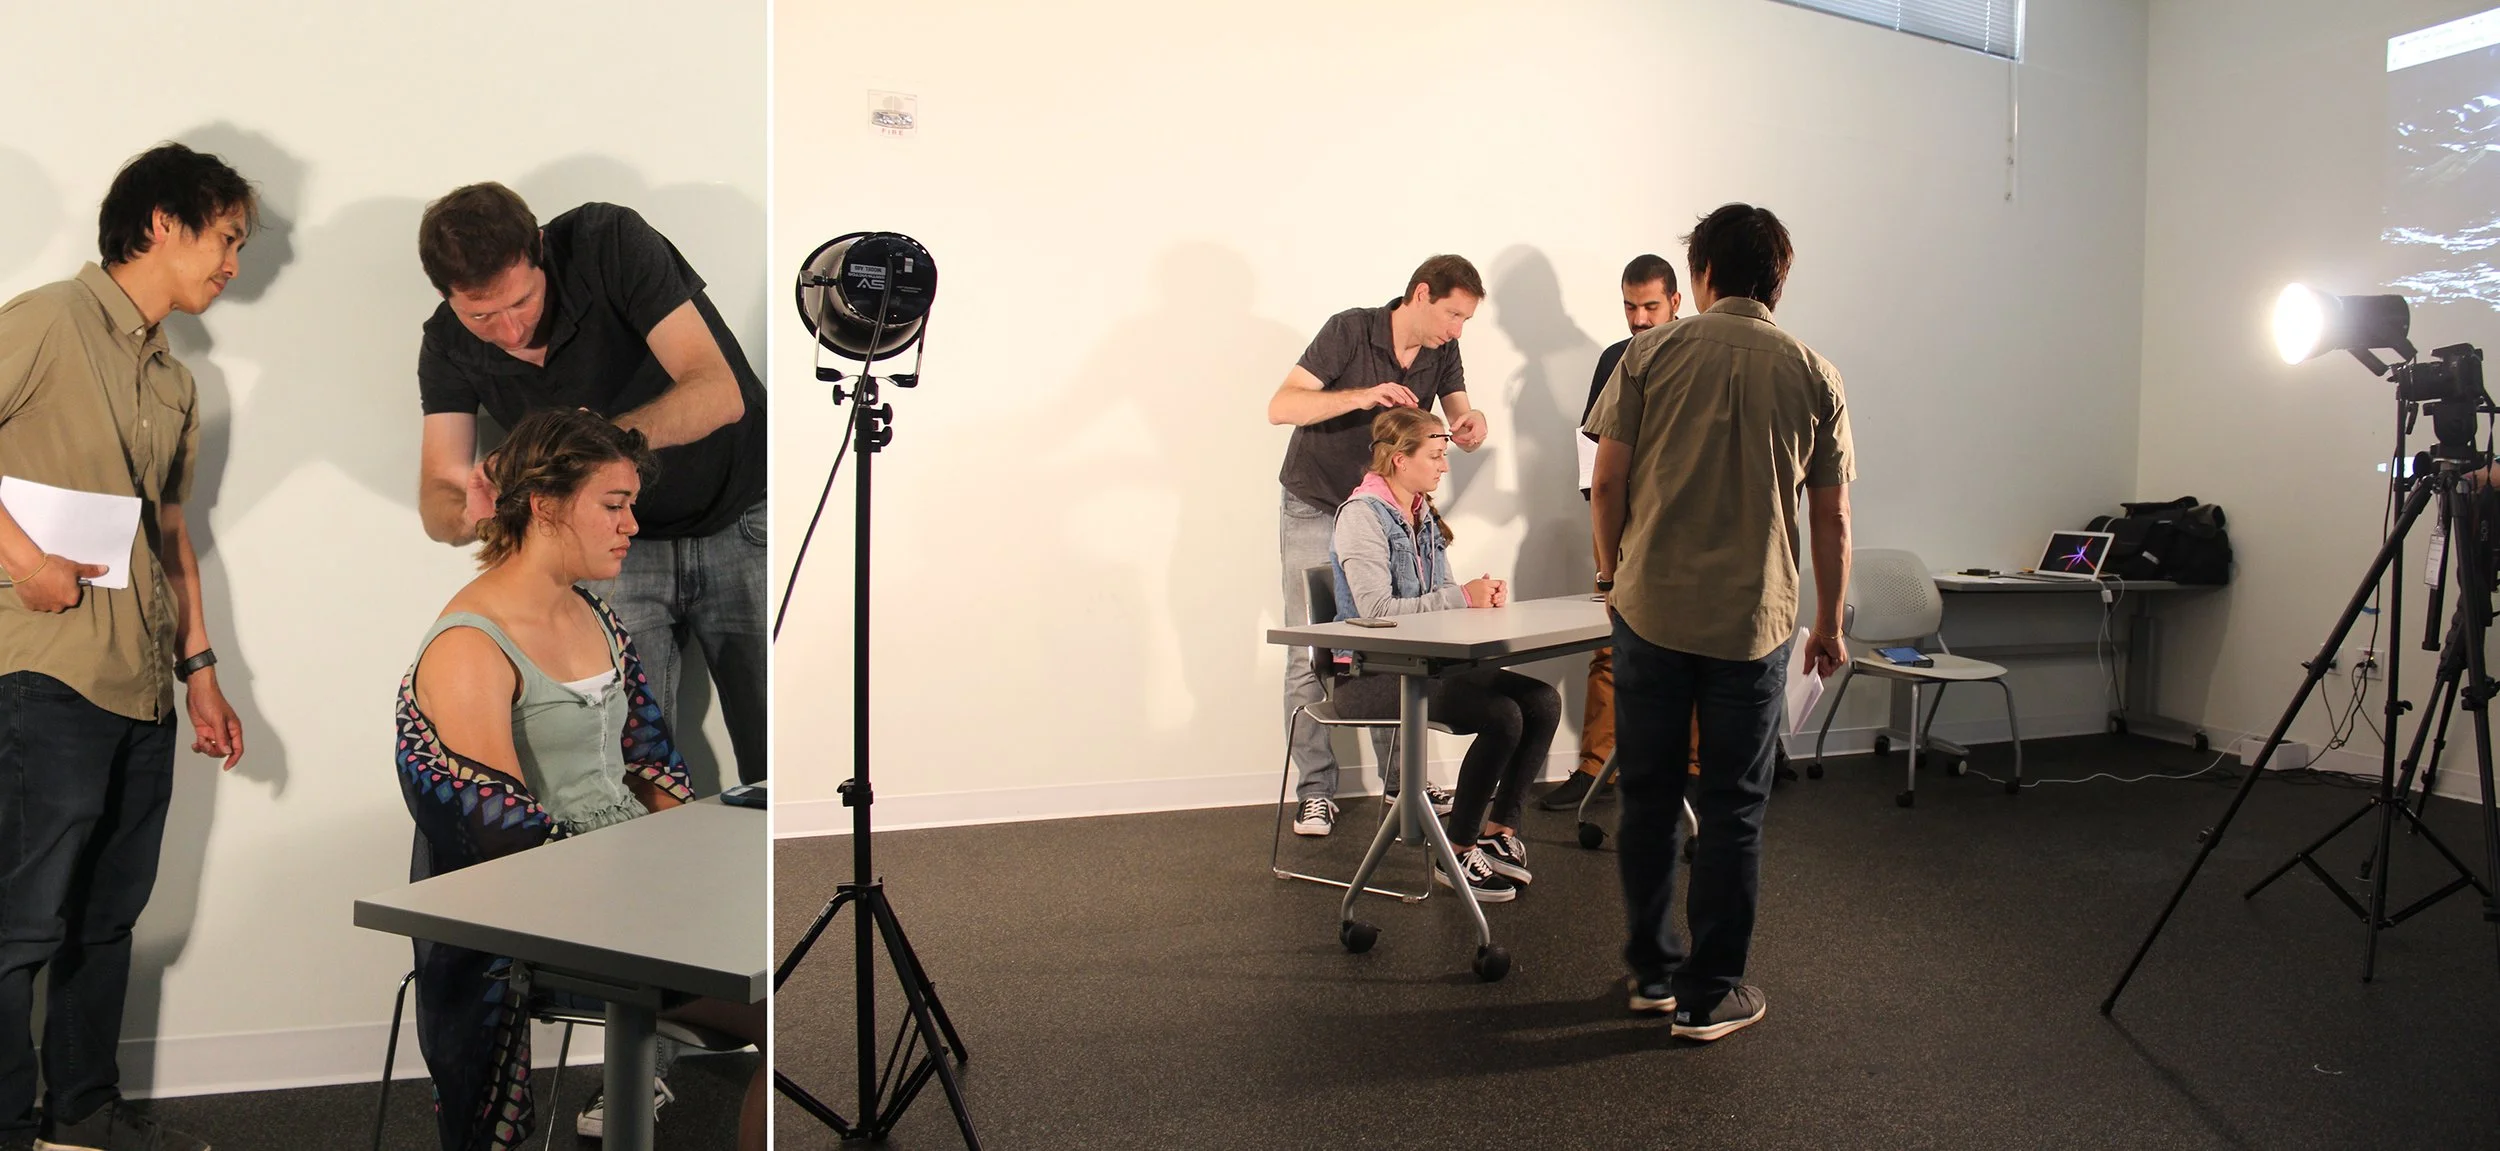
Documentation of set-up for What is it like?. University of Washington Bothell.
An artist sits at a table, imagining what it is like to be a bat
An artist sits down in a darkened room, filled with the sounds of bats and a large projection of a cave. They have just spent an hour discussing bats, listening to experts on bat behaviour and habitat, and thinking to themselves about personal associations and experiences they would relate to the animal. Now, sitting down in a darkened room, they have been tasked with silently imagining what it is like to be a bat—in whatever ways their minds wander and meander and dream. While they imagine, their brainwaves are recorded and visualized while others look on. Soon it will be their turn.
The artist imagines hanging upside down in a cave, given permission to lose themselves to the saturation of an imaginary moment. Dislocated from their usual upright position, blood rushes to their head as they gaze and listen around them. Did you know that a bat’s feet lock when they sleep—like a muscle cramp or a pitbull’s jaw—which is how they avoid falling when hanging upside down. The artist stretches their wings and finds a pleasant breeze in the damp cave, a rustling around them as they become aware of other bodies, smells, and high-pitched squeaks. They become aware of hundreds of others, a crowd, a flock, a murder—actually, a group of bats is called a colony and for good reason—they congregate in large numbers, sometimes in the hundreds, and effectively take over the spaces they inhabit.

What is it like? Participant images, shown in the process of imagining what it is like to be a bat.
Apparently, there are over 1300 species of bats, which also comprise a fifth of all mammals on the planet, according to Dr. Santana. And so the artist continues, eyes dimmed in the dark, hearing and smell becoming dominant senses, reaching out with their imagination to try and hear the echoes in the cave, to feel the sounds bouncing around, such as to gain a sense of orientation. They imagine dropping from the ceiling and flapping wings to emerge into a night sky, sensing others around them with such skill that flight formations and deviations and tornadoes of wings and ears and hungry mouths are formed.
They imagine hunting for fruit or insects, the thrill of a predatory chase, the pivot that emerges when anything else protrudes into the sensory landscape. They fly, perhaps with a sense of excitement and novelty. And then perhaps they remember they are in a room, wired to an EEG sensor, being videotaped and observed by their peers. They might be forgiven if they lost themselves for a moment to the imaginary excursion—indeed, it would be a shame if they didn’t. The return from that imaginary space carries its own disorientation, a reminder that the mind’s geographies are both intimate and spatially expansive—mapped not in the room but through the imaginative journey itself.
A geographer sits at a table imagining the (non)representation of data
A geographer sits at a table and imagines the strange status of the device on their head. It’s a consumer-grade EEG device designed to measure brainwave patterns and record them for later analysis. There are thousands of data points being accumulated and a visualization that gives real-time representative presence to the acts of thought and imagination, all parsed according to the alpha, beta, delta, theta frequencies used to map the happenings of the mind. And yet the happening mind doesn’t see itself this way.
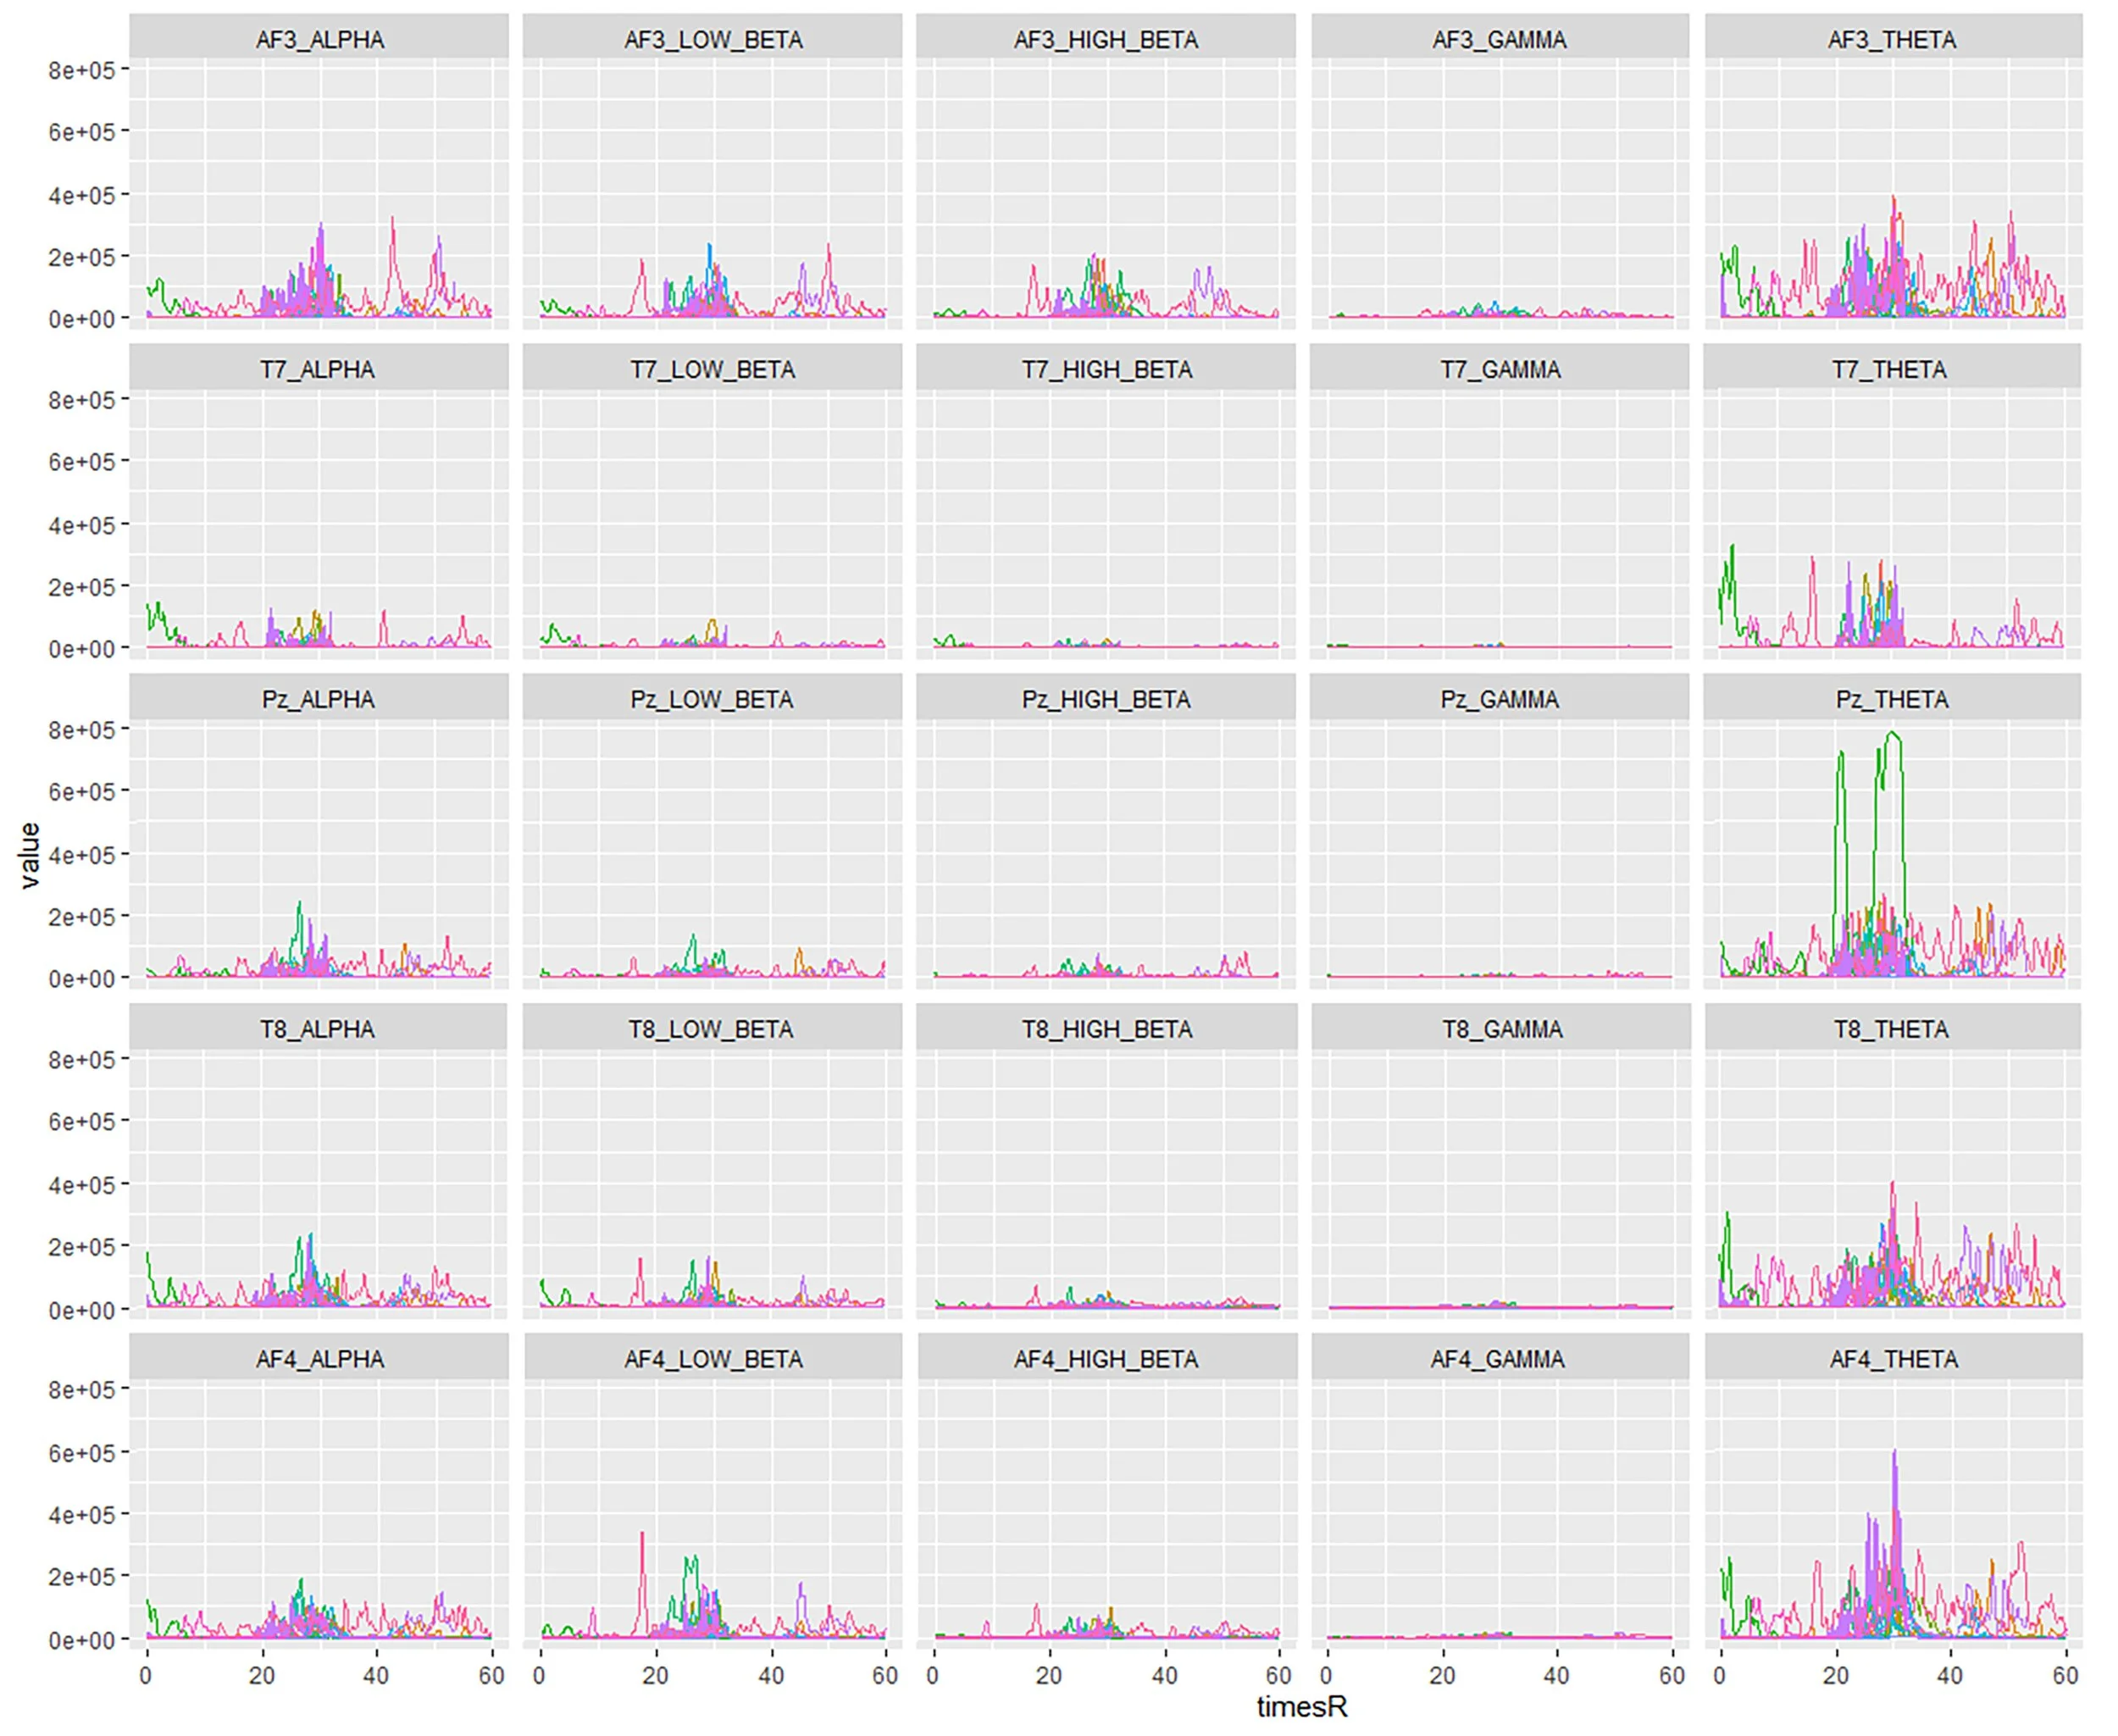
What is it like? amalgamated brainwave data sorted according to standardized brainwave frequencies (Alpha, Beta, Gamma, Theta). This visualization suggests predominant activity is in the Theta range during the experiment.
Because the project is about the imagination in any case, a different way to describe what is being represented in the sessions might be as a form of imaginary data—data that functions simultaneously as record, critique, and provocation. At first glance, data and imagining seem to be opposites. Yet here, their tension is productive: the data inevitably fail to represent the actuality of experience, while nonetheless affirming—through this very failure—that something real and affective is taking place. Ceci n’est pas une chauve-souris—this is not a bat. In some way, we might see this as a conceptual sequel to Magritte’s (1929)[iv] The Treachery of Images, where the painting of a pipe declares its own failure to be a pipe. Likewise, our visualizations of brain activity are not bats, nor even direct images of thought, but simulacra that expose the gap between experience and its representation. Yet unlike Magritte’s cool detachment, our “economy of simulacra” is grounded in human and more-than-human participation: visualizations that anchor imagination itself as both subject and method.
In some ways, it feels like a journey, a wander, a trip of some kind. It is an act of consciousness if it is anything at all. Perhaps, as simple as an act of holding space. There is nothing bat-like about any of it, and yet here the “nothings” are mapped in a certain sense, brought into space even if no space was actually involved. Imagining a bat is not an abstract activity but a specific one that, in this case, outputs a (non)representation of experience—an image that fails to capture the moment yet succeeds in holding space for its spatio-temporal and affective trace. It becomes, paradoxically, a map of nothing that gestures toward the “something it was like,” circling back to Nagel’s (1974) articulation of the unmappable character of consciousness.
This layering requires a kind of psychogeographic imagination in which certain spaces can be agreed upon even if their particularities remain elusive. The representations map a certain kind of conceptual contour, a space in which something happens, even if the experience of space itself cannot be experientially reproduced. No representation, just a series of markers of experiential intensity, designed to cultivate an awareness of the performative possibilities of the mind. In order to mark an absence as a presence what is needed is to approach the imagination geographically—or rather, psychogeographically—the idea being that imagining a bat might be seen as a space/place within the human mind to which we can go if we want, which is as rich as we make it, and which has no specific expectation of content but rather only one of volition and engagement. The data says nothing about the experience itself—it simply marks a representational intensity. The experience, rather, is generative. The map doesn’t describe the experience; it just signals to us that it’s a possible place to visit—or, better, a possible way of visiting that particular place.
A differently non-human imagination
One might imagine all the possible data in the world—synthesized, perhaps, as only intelligent machines and algorithms might do—forming a complete picture that nevertheless lacks that crucial dimension of “what it is like.” All the measurable somethings are accounted for, yet one still evades capture: the something for which there is nothing it is like.
An artificial intelligence might imagine a bat in such a way as a manifestation of data at a particular point in virtual and algorithmic space. Except that that's not quite true, but not because data can’t be thought of as algorithmically spatial. Rather, because there is some kind of something else also in play in algorithmic systems, something systematically seen as a problem rather than a trait. Despite attempts to build perfectly quantifiable systems, generative AI models reveal a familiar paradox: they too make things up. The technical term for this phenomenon—“hallucination”[v]—marks an intriguing re-emergence of imagination within the machine. Technological culture, so confident in its mastery of simulation, suddenly finds itself unsettled by its own imaginative excess.
One beautiful anecdote—an article by Chris Moran (2023)[vi], a lead editor at the Guardian, titled “ChatGPT is making up fake Guardian articles. Here’s how we’re responding.” In the article, Moran describes an email received from a researcher asking for details about a piece that the Guardian had published a few years before. They scoured their archives and even asked the reporter who authored the article, but nobody could find it. The headline seemed plausible—consistent in tone and subject—but no such piece existed. ChatGPT had invented it. “It sounds like it could have been written by me,” the journalist admitted, recognizing the unsettling accuracy of the machine’s imaginative fabrication.
We might think of the predictive algorithms that will soon shape our interactions with urban architectures and environments. Yet none of this is ever simply material. It was the psychogeography of the city that once alarmed the Situationists[vii]—and perhaps it is the psychogeography of Nagel’s pronouncement that unsettles us now. What is it like to be an algorithm, charged with completing the thoughts of those who may have forgotten how to imagine?
We call this beautiful precisely because it is so unsettling. AI researchers and journalists alike rush to correct, combat, or reprogram generative systems—to remove their capacity to hallucinate. The gesture feels familiar: a reprise of Nagel’s own impulse to strip human thought of its imaginary excess. Yet when an AI is prompted to write, it is being asked to make something up—to imagine. No surprise, then, that it does. What is perhaps more of a surprise is that it’s also quite good at it—imagining what it is like, what could be, as if a certain someone who writes about certain things might have also said a certain something. It’s perhaps not bad as a starting point for intelligence, artificial or not. It’s definitely more than human.
Discussion
The project[viii] is designed to sit at an interdisciplinary intersection of art and geovisualization. As an art project, it is a thought experiment—treating the imagination itself as a creative medium for experiencing the world differently. The experience is unique—each participant has their own version of bats, their own story of the experience, their own point of reference for how immersed they decided to go. Seen as an art project, it is not the data that matters—it is exactly the fact that the data is inaccessible to anyone except the participants themselves. One has to imagine what it might have been like for them to imagine, and in so doing, engage with the idea that there are different ways to imagine.
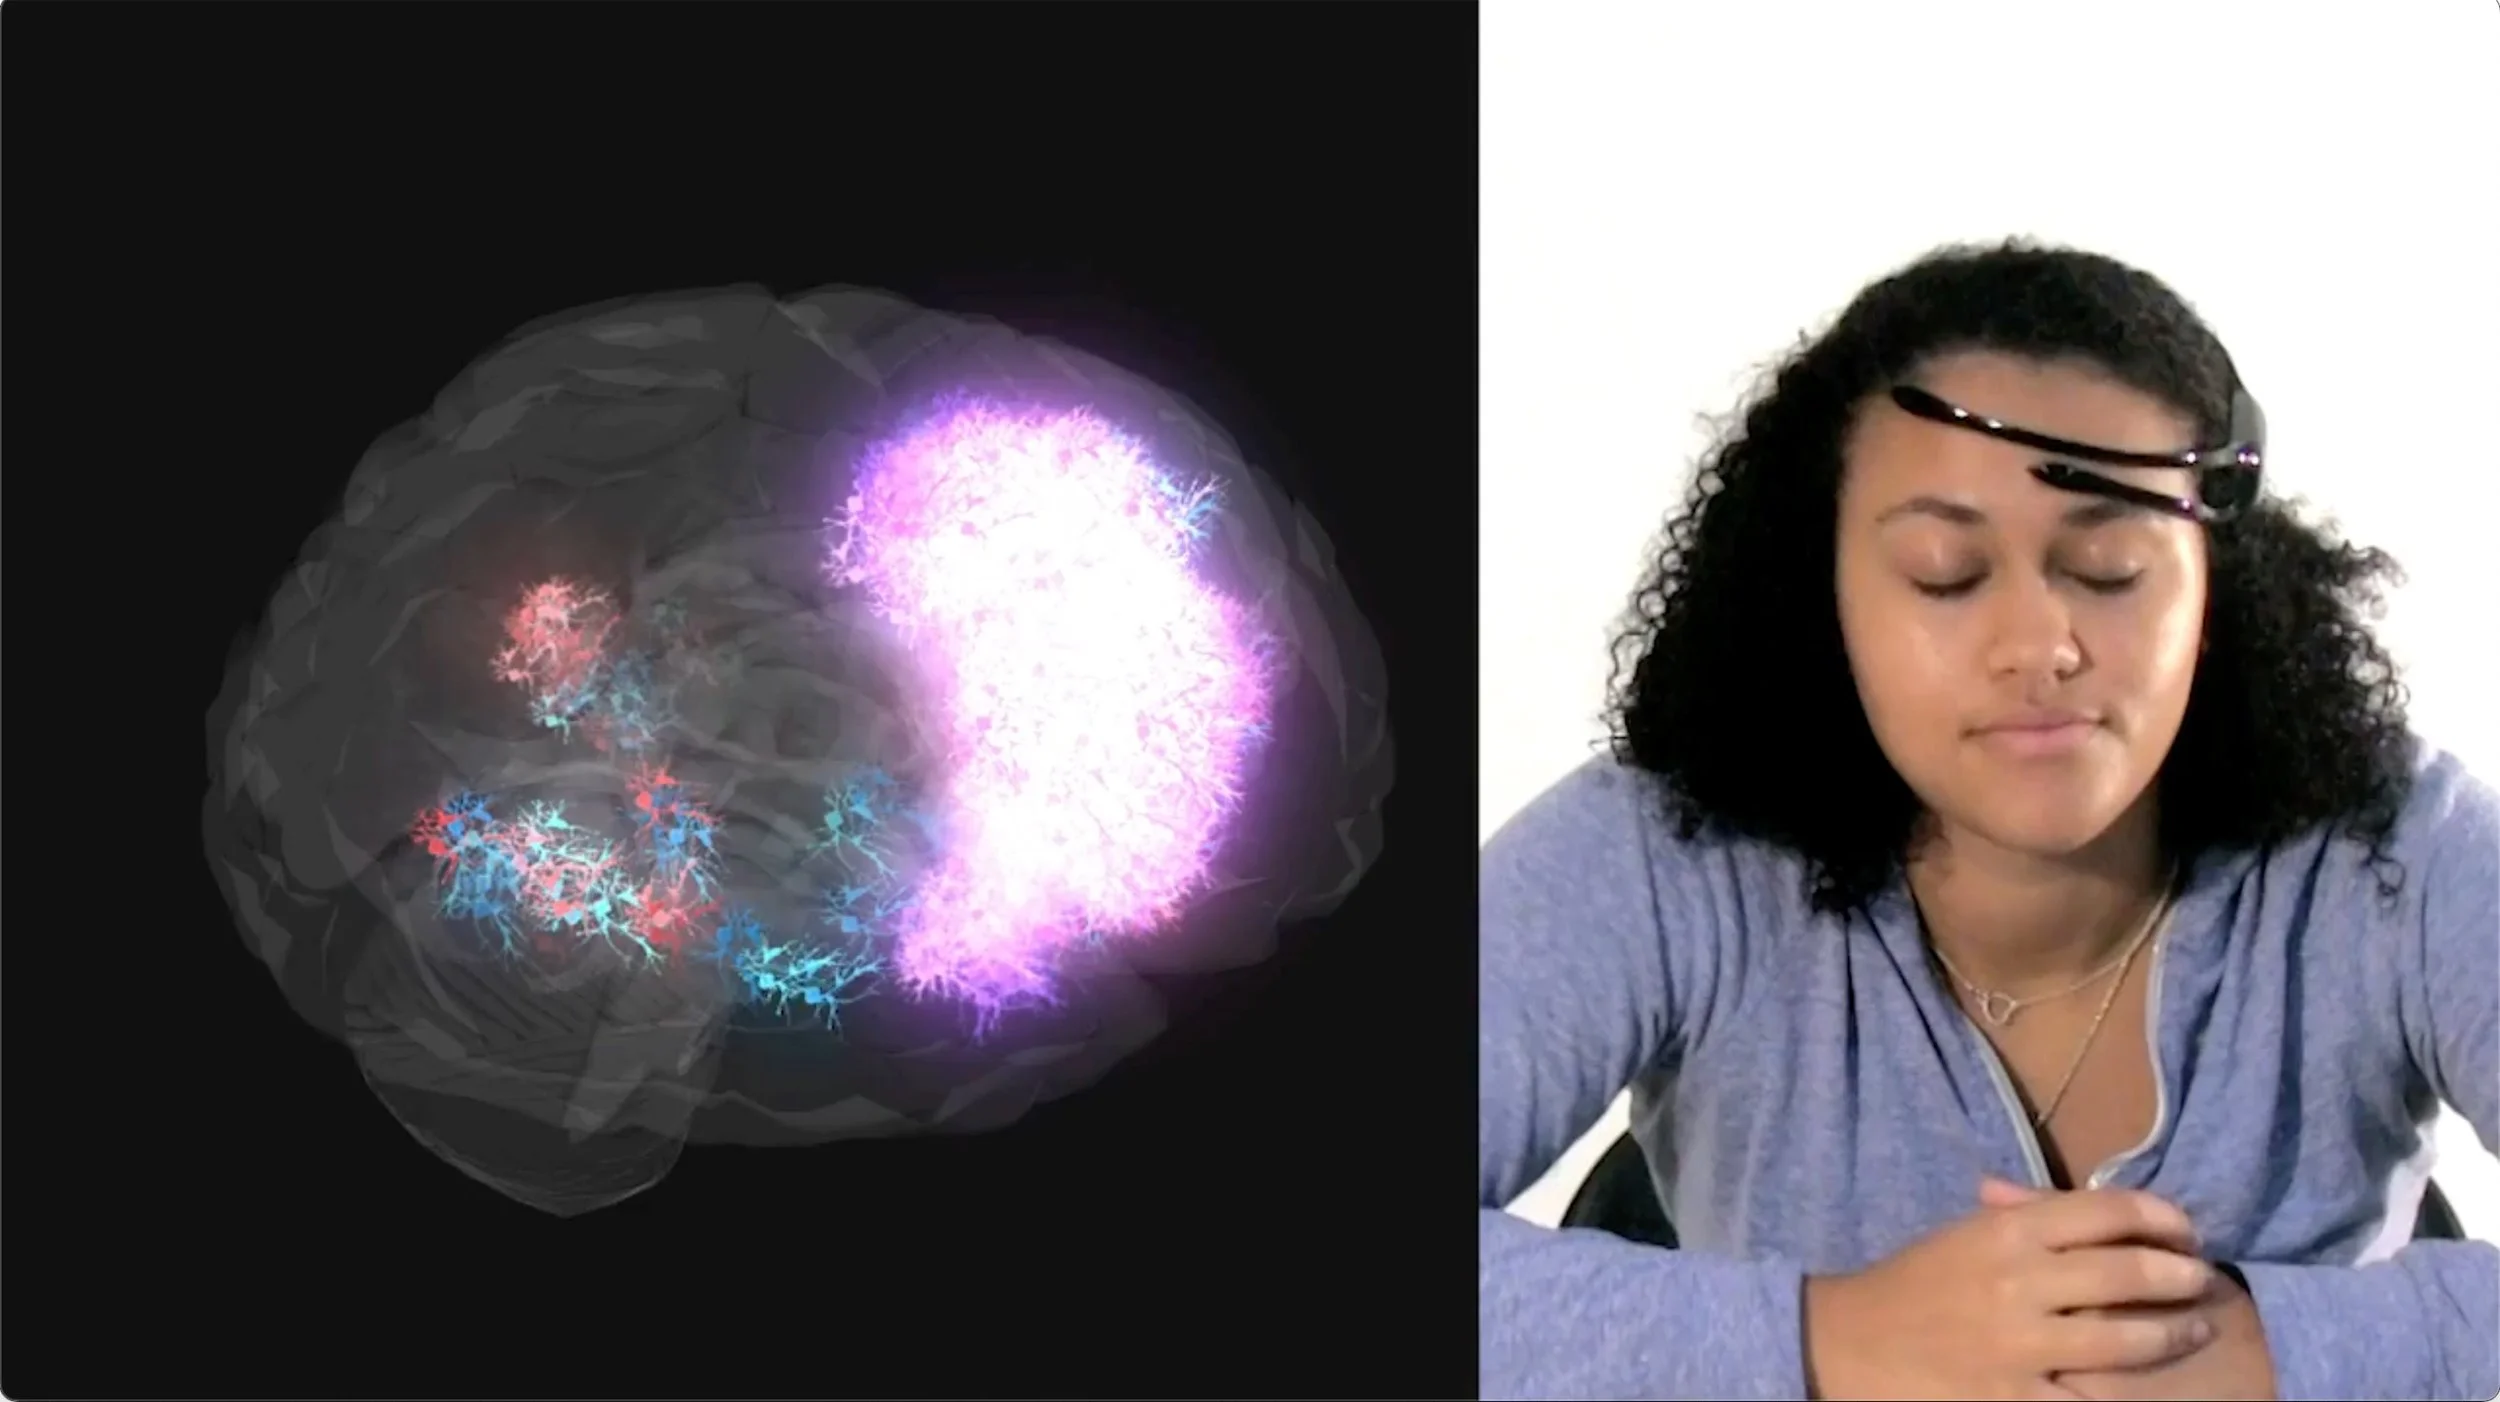
What is it like? Screen capture from video documentation of participant session, accompanied by a brainwave visualization.
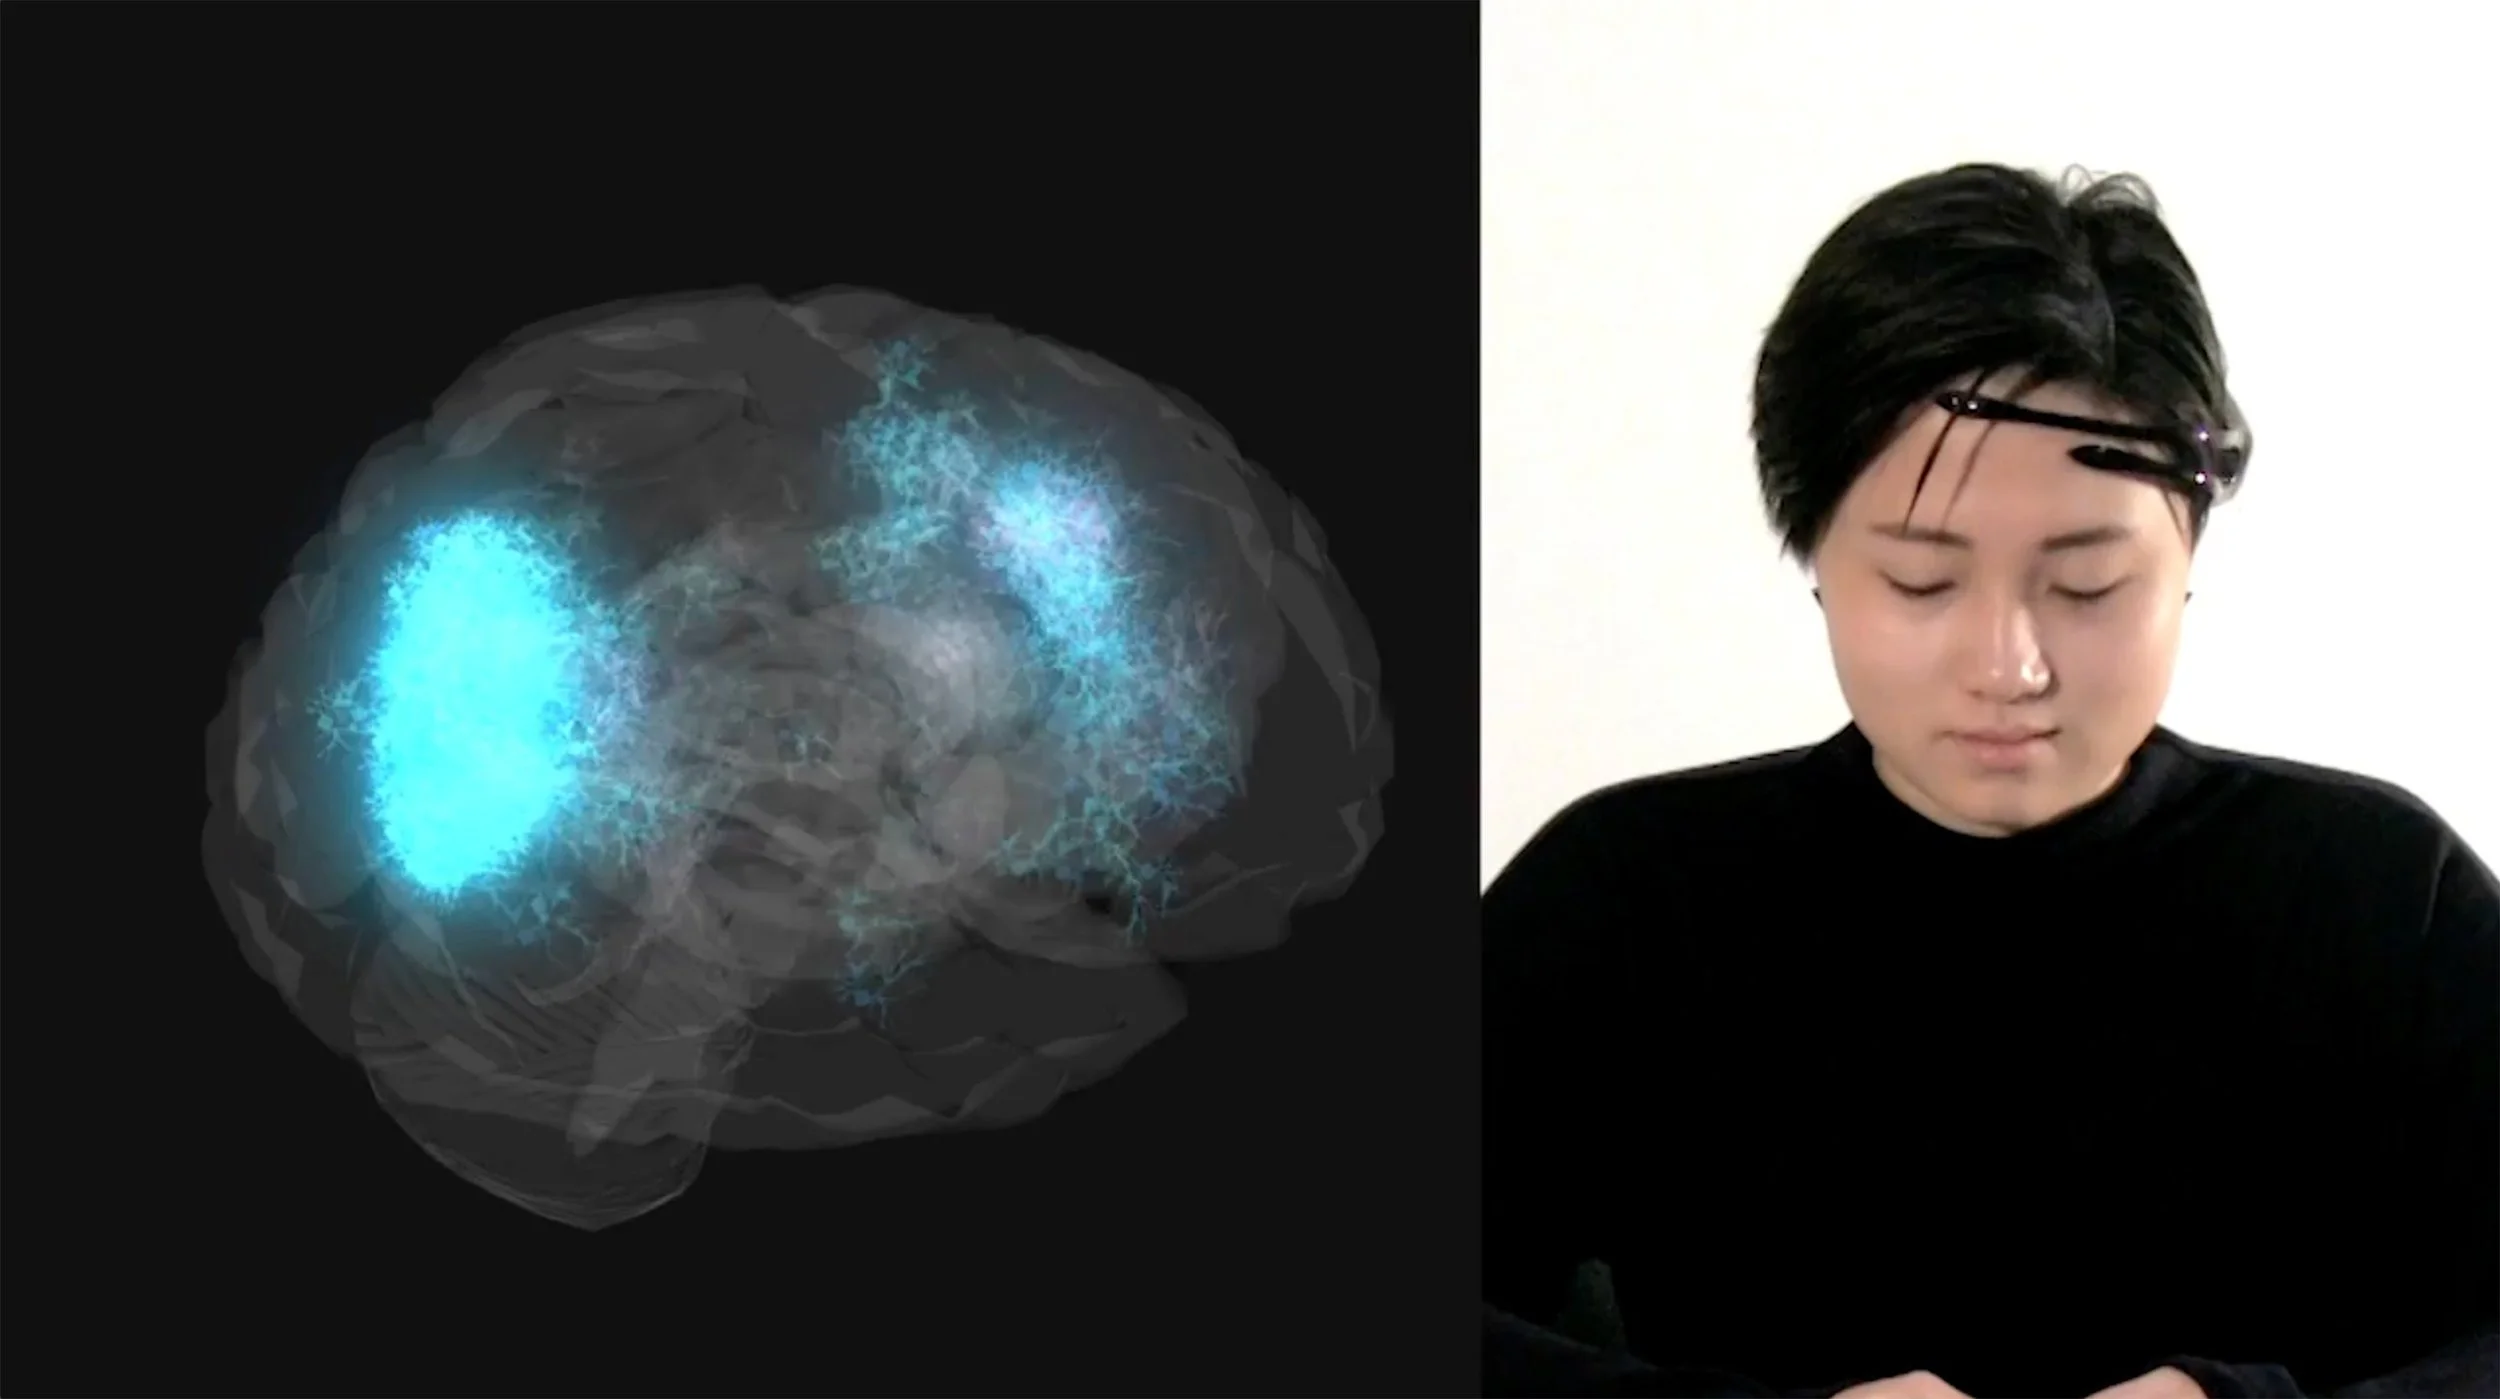
What is it like? Screen capture from video documentation of participant session, accompanied by a brainwave visualization.
As a geovisualization project, the goals are perhaps similar, with one important exception that the end goal is not just to imagine but to constitute the imagination as a holistic, creative, and qualitative form of data and experience. How might we map the experience of imagining without ignoring or reducing its content and quality? The visualization acts here to mark what we cannot see happening. It tells us that there is some kind of intensive activity in play–some kind of imagining, maybe. Yet it tells us almost nothing about what that imagining is like.
“Imaginary data” is data that requires us to imagine in order to engage with it. The EEG readings show peaks, intensities, and levels of cognitive engagement—but these values possess no communicable content without our capacity to imagine alongside them. What is it like? therefore asks its question twice: once of the participant and again of the observer. The imagination is not a problem to be solved but the connective tissue of the project—the psychogeography of a human imagining what it is like to be a bat, or indeed a human imagining what it is like to a human imagining (what it is like to be a bat). At stake is not only the possibility of the more-than-human, but also the recognition that imagination itself—human, algorithmic, or otherwise—is the generative excess through which new forms of representation and understanding emerge. At stake is the status of the imaginary in the larger context of intelligently generated futures.
Authors
Jin-Kyu Jung
Professor, Interdisciplinary Arts & Sciences, University of Washington Bothell
Ted Hiebert
Professor, Image Arts, Toronto Metropolitan University
Notes
[i] Denis Wood, “Lynch Debord: About Two Psychogeographies.” Cartographica, 45 (2010): 185-200; kanarinka. “Art-Machines, Body-Ovens, and Map-Recipes: Entries for a Psychogeographic Dictionary.” Cartographic Perspectives 53, Winter (2006): 24-40; Ted Hiebert and Jin-Kyu Jung. “Psychogeographic visualizations: or, what is it like to be a bat?.” Cultural Geographies, 27(3) (2020): 477-484.
[ii] Thomas. Nagel, ‘What is it like to be a bat?’, The Philosophical Review LXXXIII, 4 (1974)” 435-450.
[iii] For more on Santana's work, see: https://www.biology.washington.edu/people/profile/sharlene-santana
[iv] René Magritte, The Treachery of Images. (1929). Oil on canvas. Los Angeles County Museum of Art.
[v] Cade Metz and Karen Weise. “A.I. Is Getting More Powerful, but Its Hallucinations Are Getting Worse,” The New York Times (2025). https://www.nytimes.com/2025/05/05/technology/ai-hallucinations-chatgpt-google.html (May 5, 2025); Yujie Sun, Dongfang Sheng, Zihan Zhou, and Yifei Wu. “AI hallucination: towards a comprehensive classification of distorted information in artificial intelligence-generated content,” Humanit Soc Sci Commun, 11, 1278 (2024). https://doi.org/10.1057/s41599-024-03811-x
[vi] Chris Moran, “ChatGPS is making up fake Guardian articles. Here’s how we’re responding,” The Guardian (2023). https://www.theguardian.com/commentisfree/2023/apr/06/ai-chatgpt-guardian-technology-risks-fake-article (April 6, 2023).
[vii] Guy Debord. Society of the Spectacle (Detroit: Black and Red, 1983/2000); Simon Sadler. The Situationist City. (Cambridge: The MIT Press, 1998); Tom McDonough. Guy Debord and The Situationist International: Texts and Documents. (London: The MIT Press, 2002)
[viii] Full documentations of the project can be seen online at the following link (click portraits for video and visualizations): https://www.imaginationstations.net/what-is-it-like.php