An Introduction to Network Mapping and Analysis
Drew Mackie
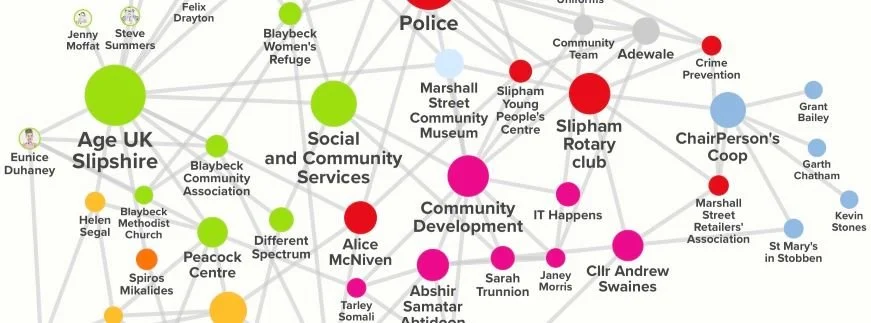
The screenshot above is of the Slipham netmapping training simulation
Background
The modern world runs on networks of all sorts. Family, friendship and community ties build your social life. At work, you’re connected to colleagues and customers. Modern communications - your phone and the internet - give you a further set of connections. Beyond your personal connections, organisations collaborate in the commercial and governmental worlds. This is all beyond complicated. It’s complex. Multiple sets of connections with multiple aims are interacting in multiple complex ways.
Network mapping tries to capture this complexity and identify its patterns. At its most basic it is a pictorial technique that you can use to visualise and track relationships. This picture is important. As the US system guru Donella Meadows[1] wrote:
Words and sentences must, by necessity, come only one at a time in a linear, logical order. Systems happen all at once. They are connected not just in one direction, but in many different directions simultaneously. To discuss these properly, it is necessary somehow to use a language that shares some of the same properties as the phenomena under discussion. Pictures work for this language better than words because you can see all the parts of the picture at once.
With practice, one can learn to ‘read’ a network map in the same way one learned to read a book or a spreadsheet. This can give you valuable hints and insights into the way the network works and how it might be changed. In larger, complex networks, you’ll need specialist software to identify these.
Creating a Map
Collecting data
Netmaps can be created in several ways. You can draw them on paper yourself based on your own knowledge of the system. Or you can do this with others in a workshop or conference. Surveys, both on and offline, can give you the data you need, or you may be able to collect it through internet research. The basic information you need covers:
The organisations or key individuals who interact in the system under study
How these connect
At its simplest, that will give you a netmap. You can add data to nodes and connections, but without these basics, you don’t have a netmap. In small maps, you will be able to see patterns emerging, and these can be used in discussion with map members to expand the map or add more detail. Larger maps need computer support to identify clusters and centralities.
SumApp[2], an online survey system, formats respondents’ data to feed the Kumu[3] and Graph Commons[4] mapping systems. It also keeps the survey open to allow respondents to update their data. The survey can also be designed to show respondents the map they are contributing to, with their response added. I have found sumApp an incredibly useful tool in creating netmaps and involving respondents.
Drawing the map
Although paper maps are useful, there are several network drawing apps that make the exercise much simpler. I must emphasise that the ones I suggest here are based on netmapping work with public, charitable and community clients as practical tools to improve collaboration. Other apps may be more appropriate to academic research.
YEd[5] - a simple online diagramming app that can also run Social Network Analysis (SNA). Data is held within the EU data space so has few GDPR issues.
•Kumu[6] - an online app capable of more sophisticated visualisation and analysis. Nodes and connections can hold a wealth of data, which can then be used to search and filter the map. Tags can be used to animate maps over time.
•Graph Commons [7] - simpler than Kumu, but can use AI to create, analyse and report on net maps from a simple prompt. Not able to hold the amount and variety of data in nodes and connections like Kumu, but really useful in tracing network characteristics.
•PRSM[8]- developed by the University of Surrey, this online system can visualise and analyse networks. Data is held in the EU data space through a server in Ireland.
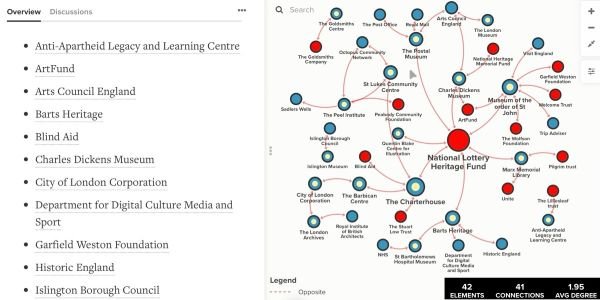
The screenshot below shows a Netmap of organisations in the Clerkenwell area of London created using Kumu. A scrollable list of organisations is on the left. On the live map, clicking on an organisation in the list will highlight the node on the map and bring up its data.
Analysis
Social Network Analysis identifies structural patterns and metrics in a network. These are dependent on how nodes are connected rather than any values in the node itself. Values ascribed to connections can be used to vary these patterns and metrics. SNA will identify:
Clusters - Nodes will gather into clusters depending on how they are connected. Although these may be identifiable by eye, in larger, more complex maps, you will need software support to define them. There are several clustering algorithms used by netmappers. Graph Commons uses the Louvain algorithm, which identifies non-overlapping clusters. Kumu uses the SLPA algorithm, which defines overlapping clusters. Although Kumu is more accurate Graph Commons is often more useful in guiding action.
Centralities - Nodes will potentially be more influential or more capable of spreading information based on their position in the network. Again, there are several different measures of centrality:
Degree - assigns a score to a node based on the number of connections it has. This can be further divided into incoming and outgoing connections (indegree and outdegree).
Closeness - measures the distance each element is from all other elements. In general, elements with high closeness can most easily spread information to the rest of the network and usually have high visibility into what is happening across the network.
Betweenness - measures how many times an element lies on the shortest path between two other elements. In general, elements with high betweenness exert greater control over the flow of information and serve as key bridges within the network. They can also be potential single points of failure.
PageRank - measures the importance of nodes by analysing the quantity and quality of links pointing to them.
There are other centrality measures available, but the above cover those in the most general and practical use.
Overall shape and structure - as you use netmaps, you will begin to recognise patterns that indicate the way the network works or where it might be deficient. Some examples:
Florets - a node and its many associated smaller nodes that have no further connection. Does this reflect reality, or did the collection of data stop with that central node?
Clusters - some major clusters will be easily identifiable by eye.
Bridges - connections that span between clusters of nodes. These will have been identified as having high betweenness but may also be obvious from the map layout.
Possible Uses
The maps are a way of trying to understand the complexity of a situation. Although they may appear chaotic, their analysis can give you hints and insights for further action. For example, make sure you have the most influential nodes onside if you wish to influence the network. Consider the gaps between clusters - how might these be filled? What nodes are lacking the resources or the will to maximise their central position, and what nodes are not well connected but have the resources and skills you need? The map is a guide. Just remember that relationships may change over time, and other circumstances may alter the degree of collaboration or participation. Nodes and connections can also be time-tagged, and you can animate these changes. Look at the map as a kind of dynamic game board on which you can plan a strategy and record changes.
Don’t get obsessed with the detail! A network map is just a useful tool in the wider process of system change.
Ten questions to ask a network map
A map itself has no immediate purpose. It will have been drawn to illustrate a general framework such as the structure of roads, the relative heights of land or the location of points of interest. It's the canvas on which any number of individual purposes may be plotted. Take a road map, for instance. There are many different ways to travel through the map. The routes you take depend on the purpose of your journey - a meandering scenic route when sightseeing, the motorway when you have to get to a business meeting and so on.
Network maps are useful in charting a social landscape and in plotting the ways that people and organisations travel through it and gather together. The following questions can help you understand and use such maps.
Who connects to whom?
This is the most basic information that you can get from a network map. It will show organisations or key individuals as nodes and collaborative activity between them (conversations, working together, giving advice, funding etc) as lines. Any situation that can be expressed in this way is a network. So, at its most basic, the map is a visual representation of how people and organisations work together. The pattern of nodes and connections can be further analysed using specialist software. This approach is known as Social Network Analysis (SNA) and has a long pedigree of use in research, business and security.
Why is this useful?
Just knowing the collaborations between the organisations and people that you are dealing with can be really helpful in deciding who to involve in a project or programme. There may be key collaborations that you wish to be a part of or you may wish to bring together organisations that don't collaborate at the moment. The network map can help you identify these and assess the possible effects of new connections.
2. What are your closest connections?
A network map will show your immediate connections - the people and organisations that you collaborate with directly. It will also show the nodes that are connected to your immediately connected nodes. You can step out from your initial node to see the possible pathways to others.
Why is this useful?
Identifying your own connections and the exchanges you have with them is in itself a useful process. You can add to this an estimate of how strong you feel a connection to be and what stories you share. This can become more powerful when you also identify what further connections they have. Of course, you can also examine other people’s close connections and step out from them.
3. Who is most central?
In any real-life network, some nodes will be more central than others because of their position on the map. These nodes will be able to influence the network more than others and are best placed to distribute information to other nodes on the map. In small, simple maps, it is usually easy to identify these nodes. In maps with large numbers of nodes and connections, specialist software is needed to pinpoint the key nodes. The concept of centrality is key to network analysis.
Understanding where a node sits on the map helps identify its influence. This is measured through three main types of centrality:
The Spreaders (Closeness Centrality): These nodes are "near" everyone else. They are ideal for quickly distributing information across the movement.
The Brokers (Betweenness Centrality): These nodes act as bridges between different groups. While they are vital for connecting disconnected clusters, they can also become bottlenecks or "single points of failure" if they stop communicating.
The Leaders (Eigenvector Centrality): These are nodes connected to other highly connected nodes, representing the most influential players in the network.
Why is this useful?
You can use centrality to identify who is most likely to influence the network - these are the organisations or individuals that you should involve in your campaign or programme. You can also identify the nodes that would have the greatest impact on the network if they were removed.
4. How do nodes cluster?
Most maps will show areas that are denser than others, where the nodes hang together because of how they are connected. We can highlight these clusters using software. Although the clusters have been entirely created from the geometry of the map, there will often be a remarkable fit to functional clusters - nodes that share some activity interest or asset. Finding these congruities gives you some confidence that the map is a reasonably accurate representation of the real-life networks it seeks to portray.
Why is this useful?
Identifying such communities of interest or action is useful in deciding who to include in events or campaigns. Some nodes may act as vital bridges between otherwise disconnected clusters.
5. What's the shortest route?
You may want to know how near to another person or organisation you are - how many connections lie between you and them. In a small network, this is easily seen. In a large network, this is much more difficult, and software can help. You may also want to know the shortest pathway between nodes that you think should be collaborating.
Why is this useful?
Many campaigns, ranging from the medical to the military, have found it more effective to target the network of nodes surrounding their actual target. It is therefore useful to know the most immediate connection pathways to the node you want to influence.
6. What assets and attributes do nodes have?
So far, we have concentrated on the form of the network rather than on the individual characteristics of its component nodes and connections. We can also record information in nodes and connections. This might typically relate to the skills and resources held by that organisation or individuals. It is also possible to determine a list of attributes across nodes and connections and to add tags. This allows us to carry out complex searches. The map becomes a database.
Why is this useful?
Knowing what you have makes it easier to decide what to do. The spread of assets within a network may be sparse or plentiful. Knowing which will help you set a strategy. Knowing where these assets are located and how willing organisations are to share, is a useful guide to action.
7. What is the strength of the connection?
Some connections are stronger than others. The strength of connection will affect how information and influence spread throughout the network. This can also change how nodes cluster and how central various nodes are. Again, software can help by incorporating the strength of connection in calculations of centrality and clustering. Further details can give different strengths of connection based on different factors such as money, information, power and so on. Software can show how the map changes according to which factor is being considered.
Why is this useful?
Knowing how strong connections are can refine the calculation of centrality. It can also help identify the nodes that will have a strong influence on a target node.
8. What is the density of the network, and how does it change over time?
Some networks are more connected than others - the density of connections is greater. It is often useful to measure the degree of connectedness of a network and to show how this measure changes over time - to illustrate the effect of a strategy or programme where connectedness is an important factor. A common way of assessing density is to compare the maximum number of links possible within a network with the actual number of links. The problem with that is that the number of possible links rises dramatically with the number of nodes according to the formula: nx(n-1)/2. Most organisations tend to have an upper limit for real interactive collaborations of around 15, and most individuals are half that. We must distinguish between membership organisations where most links are one-way and tenuous, and collaborative organisations that interact on projects.
Why is this useful?
Many complex delivery issues are concerned with connectivity. We talk of being more joined up, of collaborating and sharing. Yet we have few means of measuring what that means. Social capital is defined as the degree to which people and organisations are linked. Social network analysis provides a way of evaluating the changes in connectivity that occur as a programme develops.
9. How do assets compare with network position?
It is possible to measure how central nodes are and then compare that with the skills and resources that they control. Often, you will find that the most central nodes are not the best equipped. In some cases, they may not be able to exercise the role that the network has assigned them because they lack the assets to do so. On the other hand, a node may have plenty of resources but be so poorly connected that it can't use them to benefit the network. Comparing the balance of assets and network position gives an insight into network performance, and specialist software can demonstrate this in a “mic-mac” chart that displays quadrants that show:
High centrality / high assets
Low centrality / low assets
High centrality / low assets
Low centrality / high assets
Why is this useful?
Comparing assets held with how central organisations are gives some idea of how they contribute to the network and how they might contribute in the future.
10. How reliable/credible is network analysis?
In the last 20 years or so, there has been an upsurge in thinking about how networks of all sorts shape our lives and our surroundings. Although the approach is called social network analysis, its principles and methods have been applied in many diverse fields from public health to cell biology, military strategy, family dynamics and farming. The NHS NICE website cites over 16,000 references to social network analysis in its Evidence section.
Why is this important?
The spread of network ideas and their adoption across many fields gives some confidence in their use. Although the UK has been slow in adopting such methods, we are coming to recognise their usefulness and accept their results.
Measuring Impact Over Time
Network mapping is an effective way to measure social capital—the degree to which people and organisations are linked. By measuring the density of their network, groups can evaluate if their strategies are successfully making their network more "joined up" over time. This is important as strategic thinking around successful social movements, for example, suggests that collective action is more effective than individual group action for driving systemic change and generates greater impact by pooling resources (time, money, skills, knowledge).
Netmaps and Storytelling
Participatory mapping approaches are also increasingly used for community engagement and addressing complex societal issues. This methodology integrates participatory storytelling and network mapping to empower local communities in identifying and addressing problems like climate change and social/economic deprivation. By visualising community concerns and their interactions with support ecosystems, the approach uncovers the complexities of citizens' experiences. A participatory mapping meta-model is developed to foster collaboration within and between communities, enhancing support ecosystems and informing decision-making processes.
About the Author
Principal at Drew Mackie Associates, Drew Mackie has 40 years of experience working as a freelance consultant to government, corporate and community clients. Based in Edinburgh, he has worked all over the UK. During this time, he has developed approaches in Group storytelling, Gaming simulation and Network mapping and analysis. These methods have been used together in a range of projects across the UK, where Drew has either led or been a part of multi-disciplinary consultancy teams. Recent research work in the London borough of Lambeth is published in The Routledge Handbook of Cartographic Humanities[i]
Endnotes
[1] Meadows, D. H., Thinking in Systems: A Primer ed. Diana Wright. Chelsea Green Publishing
[2] sumApp Network Mapping tool https://greaterthanthesum.com/sumapp (accessed 16/7/2026)
[3] Kumu: Network mapping tool https://kumu.io (accessed 16/7/2026)
[4] Graph Commons: Network mapping tool https://graphcommons.com (accessed 16/7/2026)
[5] yEd Graph Editor https://www.yworks.com/products/yed (accessed 16/7/2026)
[6] Kumu: Network mapping tool https://kumu.io (accessed 16/7/2026)
[7] Graph Commons: Network mapping tool https://graphcommons.com (accessed 16/7/2026)
[8] Participatory System Mapper (PRSM) https://prsm.uk
[i] The Routledge Handbook of Cartographic Humanities (2024), eds Tania Rossetto & Laura Lo Presti